Impact of Water Activity on the Chemical Composition and Smoking Quality of Cannabis Flower: The Science of Smokability Phase I Results
Smoking remains the most common method of cannabis consumption, particularly for patients seeking rapid relief. Despite this, little is known about what defines a high-quality smokable product. This study investigated how varying water activity levels (0.45 aW, 0.65 aW, 0.85 aW) affect cannabis flower’s chemistry and perceived smoke quality. Chemical analyses showed that 0.65 aW yielded the highest terpene content and comparable cannabinoid delivery to 0.45 aW, while 0.85 aW significantly reduced cannabinoid levels. Sensory panelists noted minimal differences between 0.45 and 0.65 aW samples, though harshness and ash color varied. Higher water activity increased moisture and product weight—suggesting economic benefits for producers. These findings offer insights into optimizing water activity to balance chemical, sensory, and financial factors in cannabis production.
Introduction
The growing interest in cannabis for the expanding medical and recreational markets has created an immediate need for enhanced understanding of the factors that influence product quality, consumer safety, and the overall user experience. Despite research focusing heavily on the negative effects of smoking cannabis, there has been limited research on the effects of various cultivation and post-harvest processing practices on the final perceived quality of the cannabis smoke.(1-4) It is well-known community knowledge that a majority of medical patients prefer high-temperature, combustion conditions of flower as a therapeutic method of administration.(5,6) Smokeable products remain the most sold and consumed products on the cannabis market. This may be due to multiple factors including traditional use, unique chemical composition, social impact, and increased therapeutic value.(1,7) Investigating the quality of this medicinal formulation should be an immediate priority for the optimization of practices, increased understanding of therapeutic benefits, and as public education and risk reduction.
Many factors could ultimately affect the chemical diversity of the delivered product. Moisture content (MC) is a critical factor that plays a role in determining the desirability, smokability, and safety of cannabis flower. Water activity (aW) measures the availability of free water in a product and differs from total moisture content by directly influencing microbial growth, chemical stability, and combustion behavior. Furthermore, water activity is likely a key contributor to consumer satisfaction, product performance, and medical value.(8-11) The water activity is known in both legacy and industrial practices to affect the quality of cannabis during storage, packaging, and consumption.(12) It is standard practice in the cannabis industry to dry and cure to water activity levels around 0.65 aW to avoid microbial growth and contamination, in this experiment we chose to study levels below 0.85 aW and above 0.45 aW for a better understanding of the role of water activity when evaluating smokeability.(13) This study aims to establish standards for discrete metrics like water activity as well as contribute to optimizing the overall smokability of cannabis flower by directly involving consumer preferences.
Other industries such as food science and tobacco have well-documented research on the effects of water activity on product stability, microbial growth, and sensory attributes including aroma and texture.(14-21) Additionally, the tobacco industry has identified the effect of water activity on nicotine availability and chemical diversity of the smoke chemistry and end-user experiences including the creation of harmful byproducts.(22-27) It is apparent that these factors should be investigated with as much scientific rigor for cannabis, particularly as the legal markets and consumer demands continue to rapidly change and evolve. The rapid growth of the cannabis industry has only emphasized previous research limitations that have prevented an accurate assessment of quality due to regulatory and financial barriers. These shortcomings have created the need for rigorous validation of all prior scientific literature conducted within this framework not representative of the real-world formulations and experiences.
The Science of Smokability (SOS) studies aim to bridge critical knowledge gaps in understanding how cultivation and post-harvest processes affect the overall quality of cannabis smoke, including the user experience. By integrating analytical tools with real-world data from consumers, these experiments not only advance the science of cannabis smoke chemistry but also empower the community with evidence-based knowledge and practices. Public education is a cornerstone of this project, including the creation of accessible, community-focused educational resources to promote harm reduction and actively involve the public in shaping and participating in scientific practices in the industry. This first phase has already served as an exploratory investigation into the complexities of cannabis smoke chemistry, highlighting the need for research on the variables that contribute to its chemical diversity and the downstream impact on health and therapeutic use.
Experimental:
Smokability Survey
An online questionnaire was designed using SurveyMonkey to evaluate the smokability of cannabis pre-rolls. Two surveys were created and sent to participants: one for general consumers (n=315) and another for cannabis experts, or Ganjiers (n=38). Ganjiers are certified cannabis experts trained to assess flower, concentrates, and cartridges using a rigorous Systematic Assessment Protocol (SAP) that evaluates appearance, aroma, flavor, and anticipated effects. Through a combination of in-depth online coursework, hands-on training, and a comprehensive certification exam, Gangiers develop mastery in product evaluation, client service, as well as cannabis history, science, and ethics.
Both surveys featured identical questions, but data were analyzed separately for experts and consumers. Participants were blinded to the water activity level of the pre-rolls they received. A video tutorial provided instructions on completing the survey and determining when to answer each question. The survey consisted of 13 questions developed collaboratively by the SOS research team and a panel of Ganjiers, who applied established methods for evaluating the smoking experience. Only pre-rolls with water activity levels of 0.45 and 0.65 aW were distributed; those with 0.85 aW were excluded from consumer testing due to potential microbial risks associated with higher water activity. The survey participants were notified and recruited via social media platforms TikTok and Instagram.
Hemp Flower
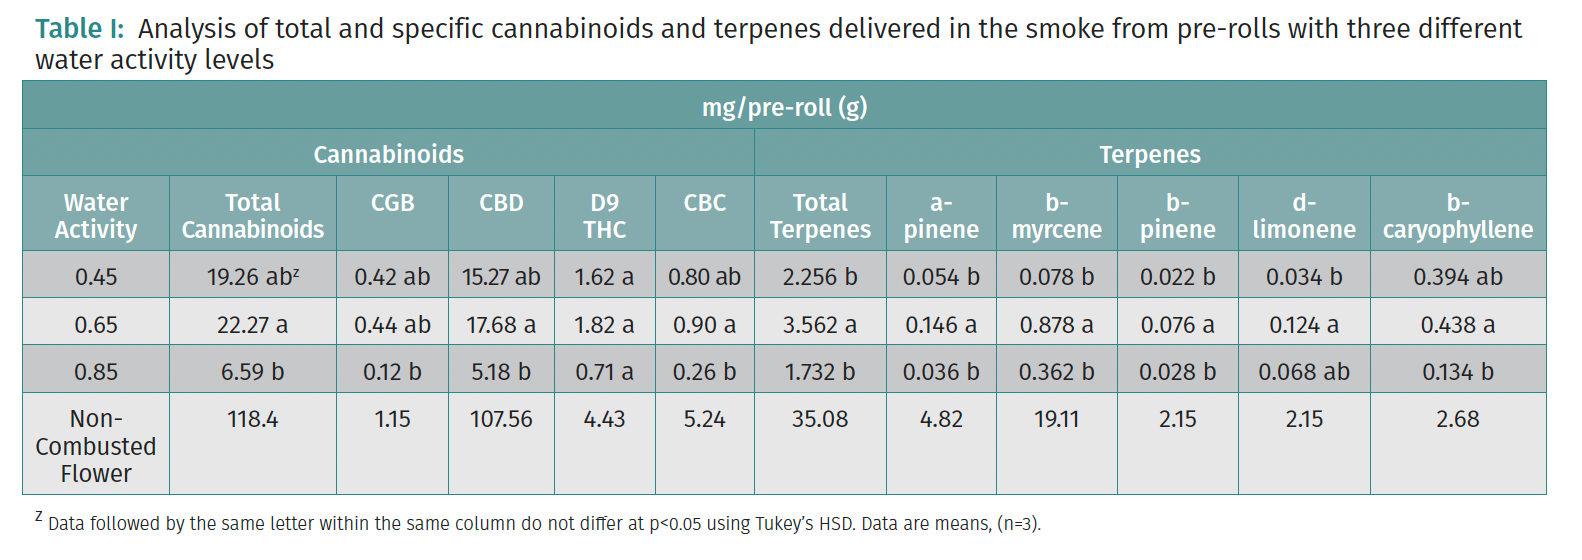
The hemp flower used for the smoking experiments as well as the pre-rolls that were used for smokability analysis was the variety ‘FunDip’. ‘FunDip’ is a cannabidiol (CBD) dominant variety bred and grown by a licensed hemp company in South Carolina, The Hemp Mine. The dominant terpenes in ‘FunDip’ are myrcene and alpha-pinene (Table I).


Table I: Analysis of total and specific cannabinoids and terpenes delivered in the smoke from pre-rolls with three different water activity levels
Pre-Roll Preparation, Packaging, and Water Activity Stability Testing
Once the flower was dried to a water activity of 0.65 in a drying room at a temperature of 65 F and 60% relative humidity, flowers were removed from stems and ground.Whole cannabis flower was ground using a Futurola OG Original Shredder (Hawthorne, California) for 15 seconds, and manually sifted to remove stems using 10 mesh. Quality checks ensured all stems were removed. One gram Custom Cones (109 mm, Natural Brown; Renton, Washington) were loaded into a Knockbox, which uses vibration to evenly pack ground cannabis into pre-rolled cones. Ground flower was evenly distributed into the cones over a 2-minute run. Fill weight and packing uniformity were regularly checked for consistency. Pre-rolls were hand-twisted at the top and individually weighed to ensure uniformity.
Prepared pre-rolls were stored in mason jars for water activity treatments targeting levels of 0.45 aW, 0.65 aW, and 0.85 aW. Water activity was adjusted using distilled water on paper towels within sealed containers, monitored with a digital hygrometer. Once stabilized at the target water activity, pre-rolls were placed in plastic tubes with rubber gasket seals, vacuum-sealed with a commercial-grade vacuum sealer and heavy-duty 4 mil vacuum sealer bags to maintain water activity integrity. Stability assessments confirmed that the process preserved target water activity levels for at least 30 days. Vacuum-sealed pre-rolls were shipped to participants within 24 hours, arriving within 3 business days, with participants completing their smoke study within 5 days of receipt. Ground flower material that was analyzed for cannabinoid and terpenes content was sent as ground loose flower not inside a preroll cone.
Smoking Machine
A Cambustion Smoke Analyzer SCS (Cambridge, United Kingdom) was employed to measure the pressure drop across each pre-roll, collect smoke condensate for chemical analysis, and retain the remaining ash for organic analysis. The smoking method utilized was adapted from the Health Canada protocol for tobacco use (ISO 3308, Health Canada Intense).(28) Temperature was monitored 1 cm downstream from the pre-roll, simulating a consumer's mouth position, using a thermocouple. Smoke condensate was captured in a 50 mL glass impinger containing 10 mL of HPLC grade ethanol, which was maintained on ice to minimize evaporation. All impingers, beakers, and associated equipment were cleaned via rinsing in ethanol, cleaning with laboratory grade soap (Alconox), rinsing with water, followed by a 2 minute sonication with ethanol and air drying between samples. The smoking machine's orifice and plastic tubing were similarly cleaned between samples and sample types to prevent cross-contamination.
Dry Ash Analysis
Ash was collected from pre-rolls used in the smoking machine and analyzed at the Clemson University Agricultural Service Laboratory. Reagents included 1 N hydrochloric acid, prepared by diluting 83.3 mL concentrated HCl to 1 L with deionized water (dH₂O), and 6 N hydrochloric acid, prepared by diluting 50 mL concentrated HCl to 100 mL with dH₂O. Apparatus used included a muffle furnace, "high form" porcelain crucibles, 100 mL volumetric flasks, and 13 × 100 mm flint glass test tubes. For the procedure, 1.000 g of sample was weighed into a porcelain crucible and ashed in a muffle furnace by gradually increasing the temperature to 500°C and maintaining for 3 hours. The ashed sample was wetted with a small volume of dH₂O, treated with 5–10 mL of 6 N HCl, and evaporated to near dryness on a hot plate. The residue was dissolved in 10 mL of 1 N HCl, quantitatively transferred into a 100 mL volumetric flask, and washed down with dH₂O. The solution was diluted to volume with dH₂O, shaken, and an aliquot was transferred into an ICP test tube for analysis.
Cannabinoid and Terpene Analysis
All samples were analyzed at MCR Labs, MA.Cannabinoid reference standards were acquired from Cerilliant Corporation and Cayman Chemical Company. Terpenes standards were acquired from LGC Standards.
UHPLC Conditions: Samples were either directly injected or diluted 1:10 in Methanol and injected directly. Roach samples were agitated with 10mL MeOH for 10 minutes at room temperature and then centrifuged to remove particulates and diluted between 1:2 and 1:10 in MeOH for direct HPLC injection. Reversed-phase chromatography was conducted using an Agilent 1290 UHPLC system with OpenLab CDS Rev C.01.10, including an autosampler with thermostat, binary pump, column oven, and diode array detector. Peak integration was performed with Agilent ChemStation. The final analysis was carried out on a Restek Raptor ARC-18 column (100 mm × 3.0 mm, 1.8 µm) using gradient elution with 5 mM ammonium formate (0.1% FA) in water and acetonitrile (0.1% FA) as the organic phase. The injection volume was 2.00 µL, with a column temperature of 30 °C, the autosampler is equipped with a chiller kept at 4 °C, and a flow rate of 1.0 mL/minute. Cannabinoids were monitored at λ = 228 nm (reference λ = 360), with spectra acquired from 190–400 nm at a step size of 2 nm. Integration was performed using Agilent’s standard parameters.
GC-MS Conditions : Samples were either directly injected or diluted 1:10 in Methanol and injected directly. Gas chromatography was conducted using an Agilent 7980 GC system, including an automated liquid sampler and an Agilent 5975 inert XL MSD. Agilent MassHunter software and processing was used to acquire and analyze the data. Analysis was done on a Restek Rxi-624Sil MS column (30 m, 0.25 mm ID, 1.40 µm) with He as the carrier gas at a 100:1 split ratio and a constant flow of 1 mL/minute. The injection volume was 1.00 µL, with an inlet temperature of 250 °C. The column oven started at 60 °C, ramped to 320 °C, with a total runtime of 23 minutes. The MSD source temperature was set to 230 °C, and the quad temperature was set to 150 °C. Single ion monitoring for terpenes was done with full scan data from 30–750 Da for untargeted analysis.
Statistical Analysis of SurveyMonkey Data of Ash Color, Smokability and Potency
The raw survey data were downloaded from SurveyMonkey and cleaned using Python’s pandas library. A statistical analysis to compare the proportions of survey responses between two groups categorized by water activity levels (aW = 0.45 and aW = 0.65) was performed utilizing python329 and statsmodels 0.14.430. For each response category, percentages were calculated using the observed counts divided by the total responses for each group. A two-proportion Z-test was applied to assess whether the differences in response proportions between the two groups were statistically significant (p value less than 0.05). The test results, including Z-statistics, p-values, and group percentages, were compiled into a summary table to identify significant differences. This methodology provides a robust framework for evaluating proportional differences in survey responses across distinct groups. Cannabinoid, terpene and ash statistical analyses were performed using JMP® statistical software (Version 18, SAS Institute Inc., Cary, NC, USA). Mean comparisons were conducted using Tukey's Honestly Significant Difference (HSD) test, with statistical significance established at p < 0.05.
Results
QUANTITATIVE RESULTS
Cannabinoids
The flower material in the pre-rolls contained primarily acidic cannabinoids, such as cannabidiolic acid (CBDA). However, the smoke analysis revealed no significant amount of acidic cannabinoids, indicating complete decarboxylation during combustion. The cannabinoid content in the flower and pre-rolls was quantified in milligrams per unit, converted from weight percent values (Table I). For the flower sample, ‘FunDip’, the acidic cannabinoid content was converted to that of the fully decarboxylated or neutral form by multiplying by the ratio of molecular masses (0.877 in the case of CBDA and THCA). Since CBDA was not detected in the smoke and only CBD was detected, the results are better described in terms of total CBD content.
CBD was the dominant cannabinoid in both the flower (as CBDA) and the smoke (as CBD). Additionally, cannabinoids such as cannabigerol (CBG), cannabichromene (CBC), and D9-tetrahydrocannabol (∆9-THC) were present in flower and the smoke. The pre-rolls with a water activity of 0.65 produced the highest cannabinoid concentrations in the smoke, followed closely by those with a water activity of 0.45. In contrast, the cannabinoid concentrations of the 0.85 aW samples were approximately 30% of those observed in the 0.65 aW samples (Table I).
Variability in cannabinoid content was large but consistent with previous findings,(1,3) emphasizing the inherent variability in preparing pre-rolls. The percentage yield of the amount of each cannabinoid transferred from the pre-roll to the impinger indicated that the lowest percentage yields were observed in samples containing 0.85 aW, consistent with their reduced smoke cannabinoid concentrations.
Terpenes and other secondary metabolites
The terpene content in the flower material, expressed in milligrams per pre-roll, reports total terpene concentrations and the five most abundant terpenes. The percentage yield of terpenes was omitted due to consistently poor results across all samples. Among the tested pre-rolls, the 0.65 aW samples demonstrated the highest terpene delivery to the smoke, a difference that was statistically significant (Table I). Compared to cannabinoids, the distinction between 0.65 and 0.45 aW samples was more pronounced, suggesting stronger water activity-dependent effects for terpene transfer in this range. In contrast, the 0.85 aW sample percentage yields were relatively better for terpenes than for cannabinoids but still delivered lower amounts overall.
Individual terpene patterns revealed intriguing trends. The highest concentrations of all terpenes were consistently obtained from 0.65 aW samples. However, the relative ranking between 0.45 and 0.85 aW samples varied depending on the terpene. For alpha-pinene, beta-pinene, myrcene and limonene, there was no statistically significant difference between 0.45 and 0.85 aW samples. Additionally, d-limonene was delivered at the highest concentration at 0.65 but was not statistically different from the highest water activity. Beta-caryophyllene had similar concentrations at the two lower water activities and was significantly lower than 0.85 aW. Based on these findings, the 0.65 aW samples are expected to deliver the most pronounced flavor profile due to their greater terpene yield.
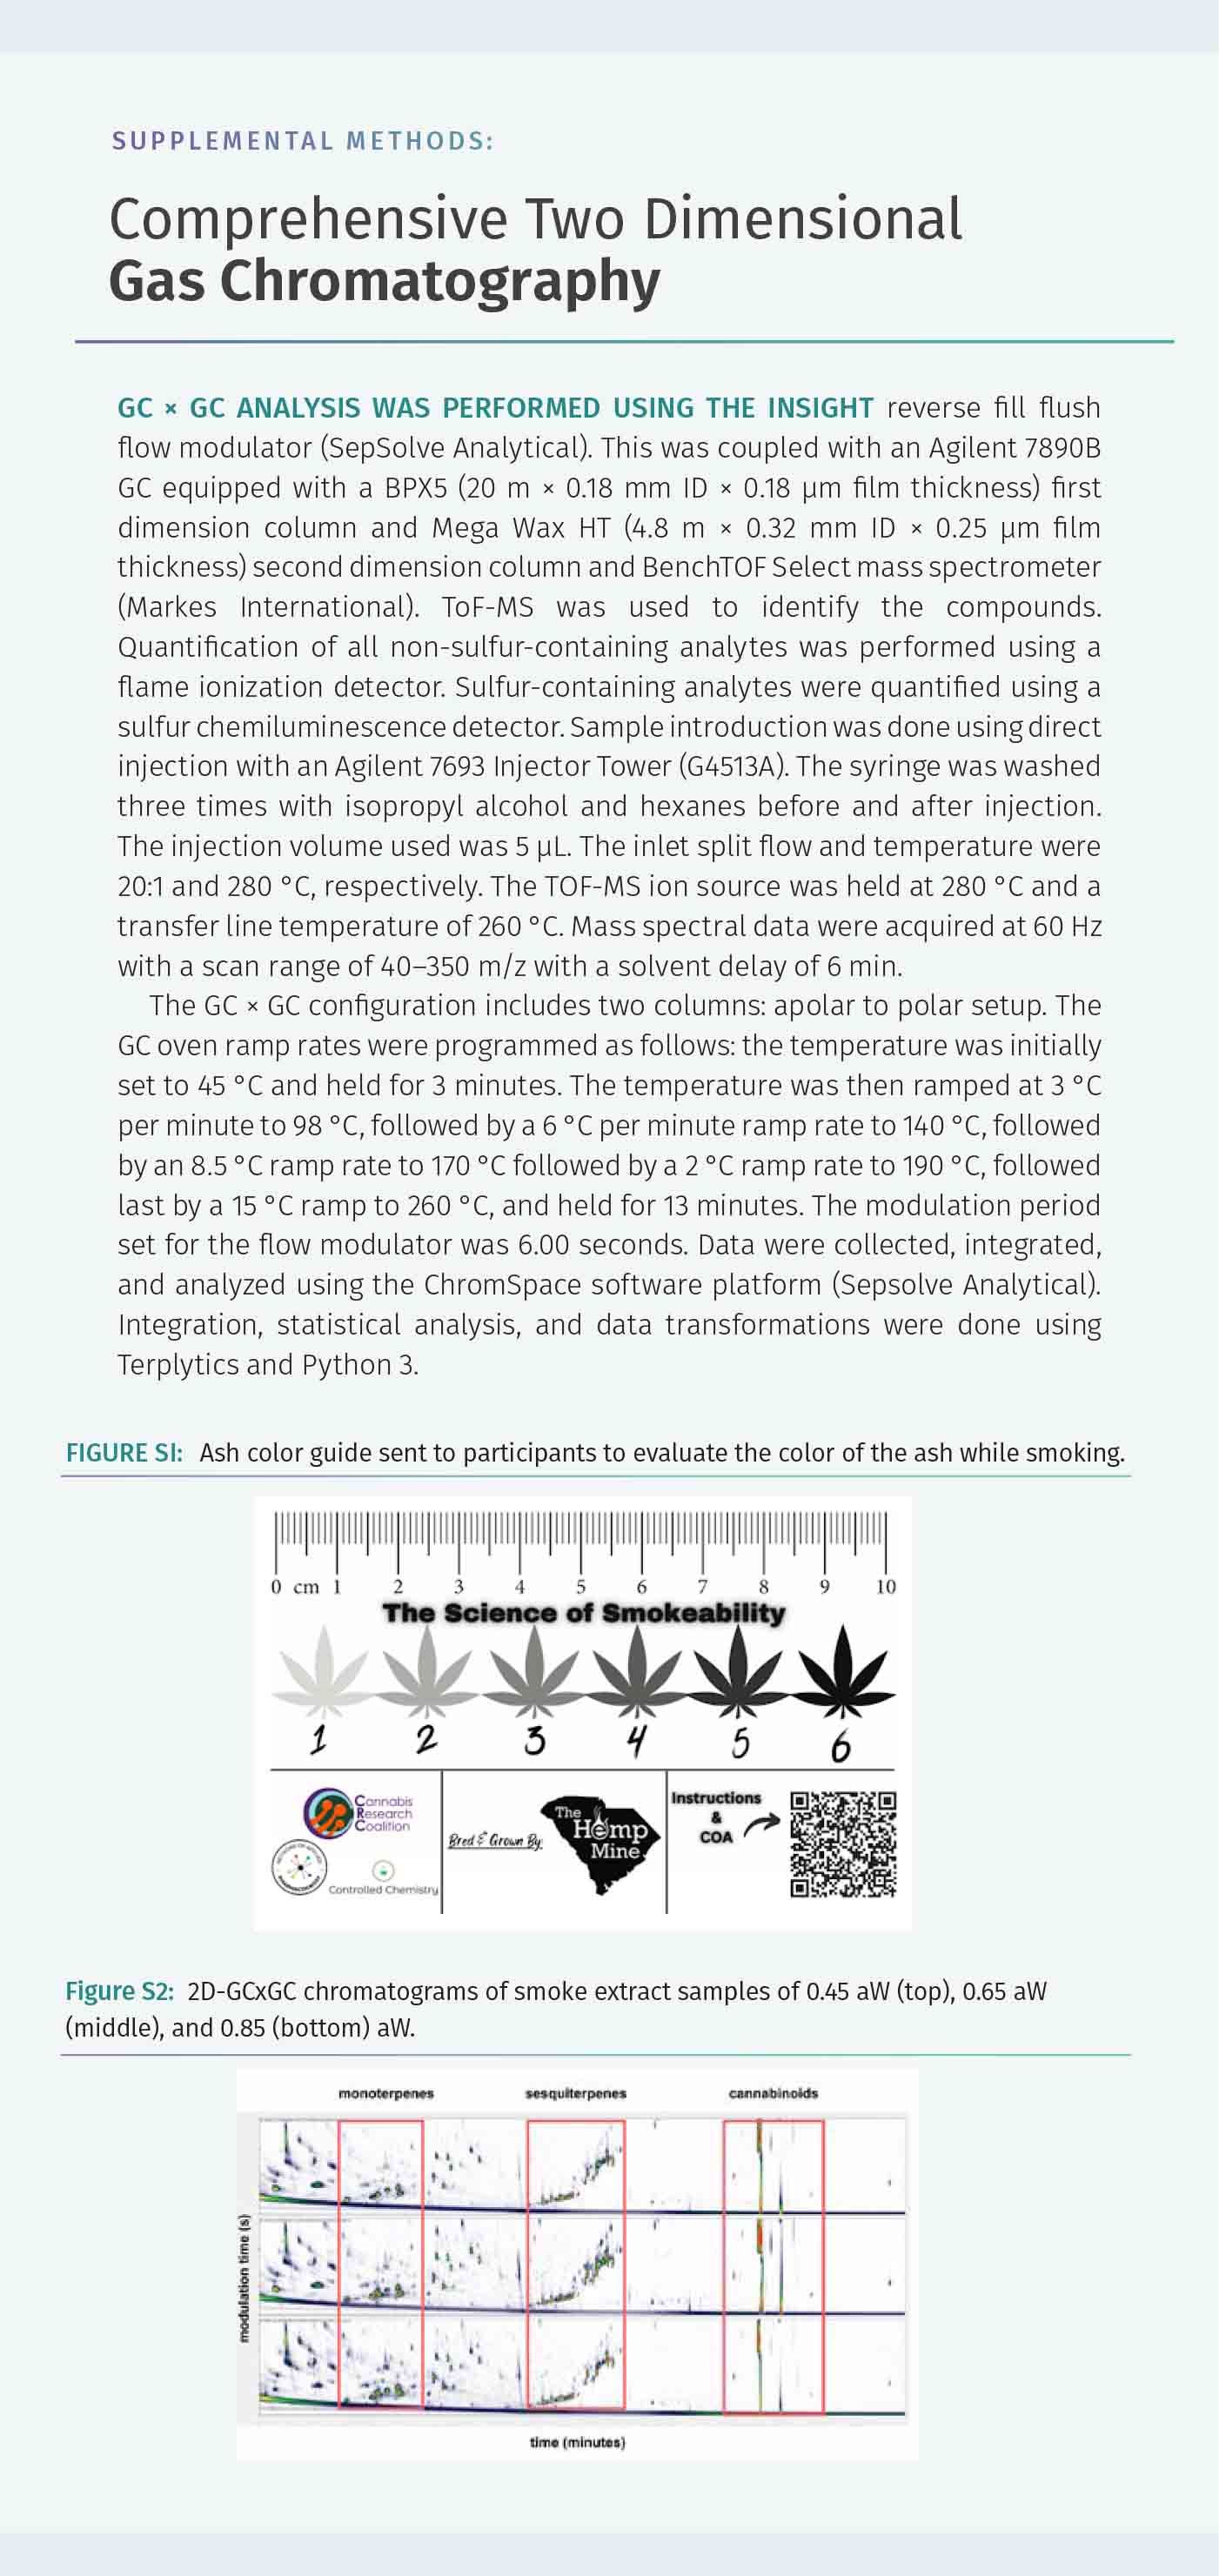
Abstrax Tech investigated how water activity affected other non-terpenoid and non-cannabinoid secondary metabolites by 2D GCxGC chromatography (Figure S2), including substances not typically characterized in the smoke.(31-33) Qualitative differences were identifiable in the monoterpene, sesquiterpene and cannabinoid regions. Further characterization of these and other substances is needed to determine and establish more quantitative metrics of quality for cannabis smoke.

, 0.65 aW (middle), and 0.85 (bottom) aW.")
Supplemental Methods: Comprehensive Two Dimensional Gas Chromatography
Figure S1: Ash color guide sent to participants to evaluate the color of the ash while smoking.
Figure S2: 2D-GCxGC chromatograms of smoke extract samples of 0.45 aW (top), 0.65 aW (middle), and 0.85 (bottom) aW.
Elemental Analysis
The ICP analysis (Inductively Coupled Plasma Spectroscopy) of the resulting ash from the three water activity samples showed minimal variability in elemental concentrations across the groups. Elemental concentrations in the ash were consistent and comparable between the 0.45, 0.65, and 0.85 aW samples, except for calcium. Calcium concentrations in the 0.85 aW treatment group were significantly greater than the lower water activity treatments (Figure 1). The underlying cause of this difference remains unclear and warrants further investigation.


Figure 1: Elemental concentration in ppm of ash from three combusted test groups.
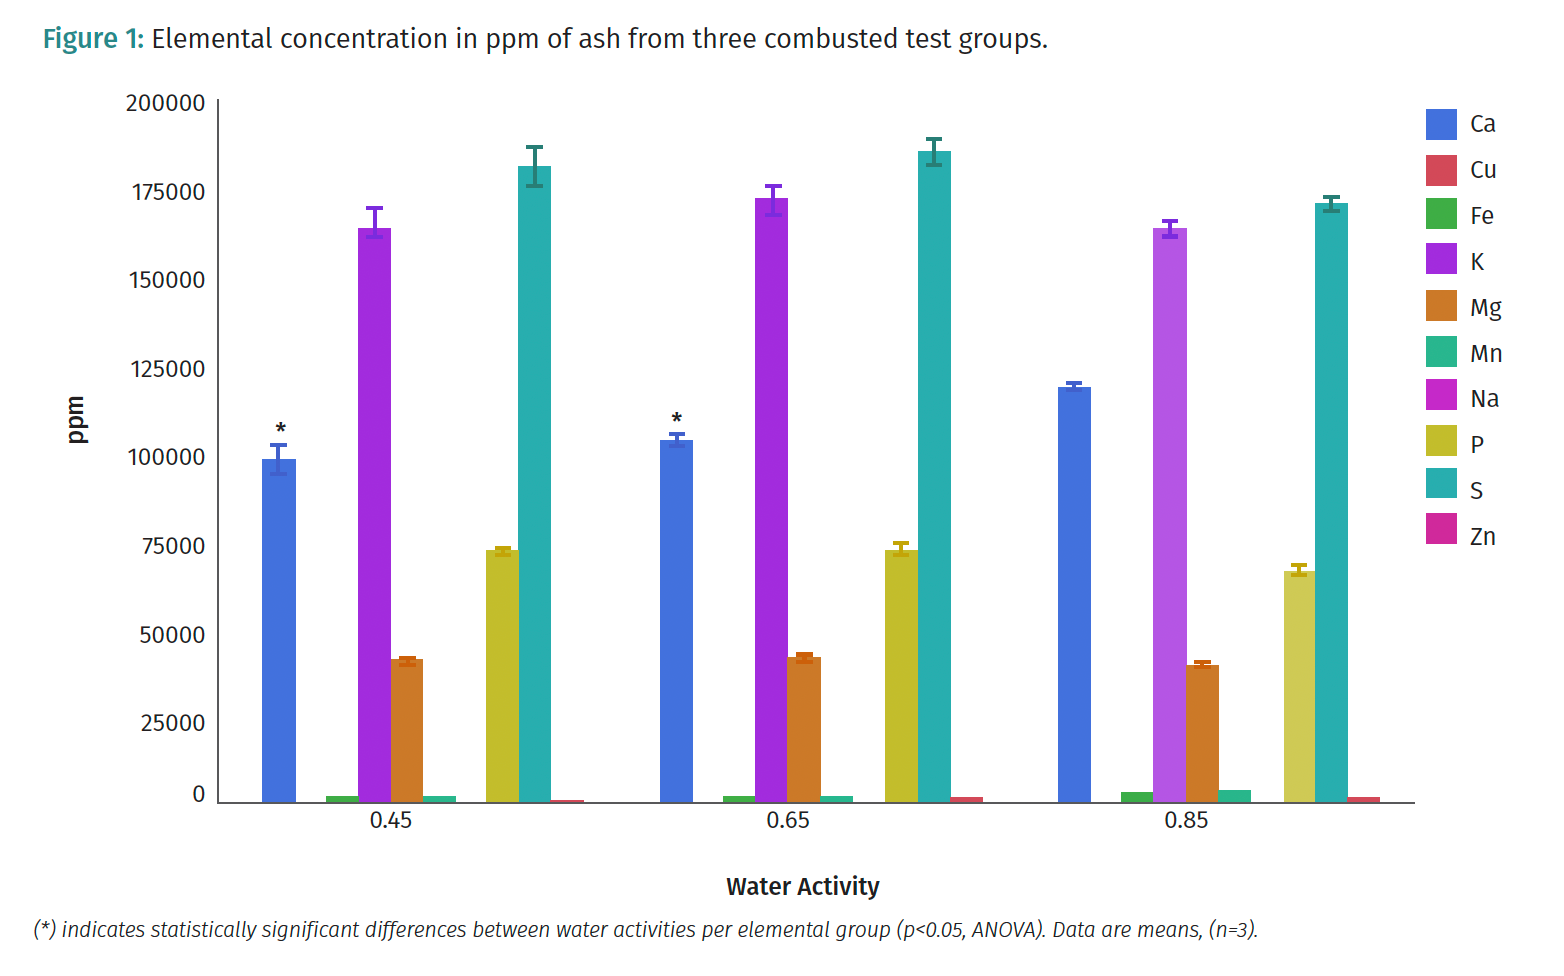
When compared to the elemental composition of tobacco ash as reported by Dumas, the cannabis ash samples exhibited similar levels for most elements, with the exception of markedly elevated sulfur and phosphorus concentrations and a significantly reduced calcium content.(26) These deviations are likely attributable to differences in cultivation practices, particularly fertilization and pesticide use. Elemental sulfur is commonly applied during the early stages of cannabis growth as a treatment against russet mites (Aculops lycopersici), which may contribute to the elevated sulfur levels observed in the ash. Likewise, excessive phosphorus application is a frequent practice in commercial cannabis production, potentially explaining the increased phosphorus content.(34,35)

. SurveyMonkey responses noting the irritability of the cannabis smoke at 0.45 aW, (n= 132).")
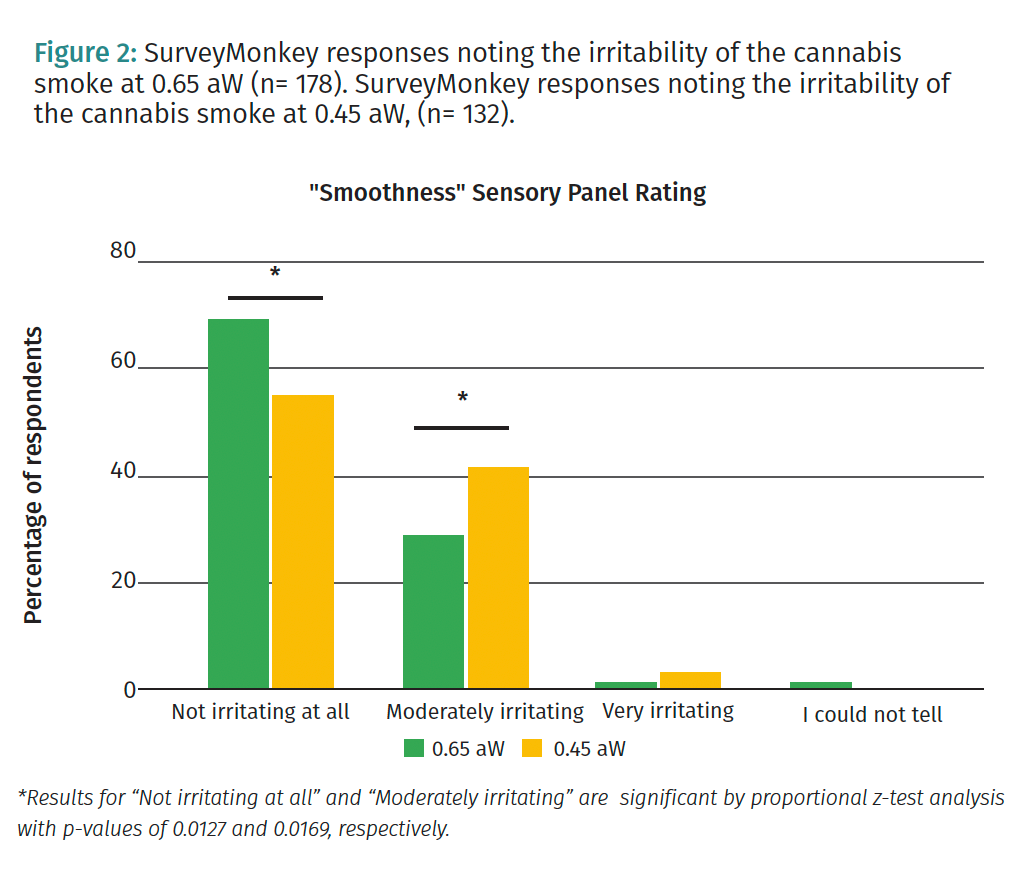
Figure 2: SurveyMonkey responses noting the irritability of the cannabis smoke at 0.65 aW (n= 178). SurveyMonkey responses noting the irritability of the cannabis smoke at 0.45 aW, (n= 132).
Qualitative Results
Sensory attributes were investigated in different water activity (aW) groups. For aromatic profile and flavor intensity, the results were similar between the 0.45 and 0.65 aW pre-rolls with no statistical differences. Notably, these groups were ranked differently by the general population compared to certified Ganjiers, but the variability exceeded the numerical differences. Overall desirability slightly favored the 0.65 aW pre-rolls, though large variability rendered this distinction inconclusive (data not shown).
Regarding the “smoothness” of the smoke, responses ranged from not irritating to very irritating with the 0.45 aW pre-rolls producing a more irritating experience, and less noted it was not irritating at all (Figure 2). For the rating of “not irritating at all” and “moderately irritating,” the difference between the two groups was statistically significant with p values of 0.013 and 0.017, respectively.
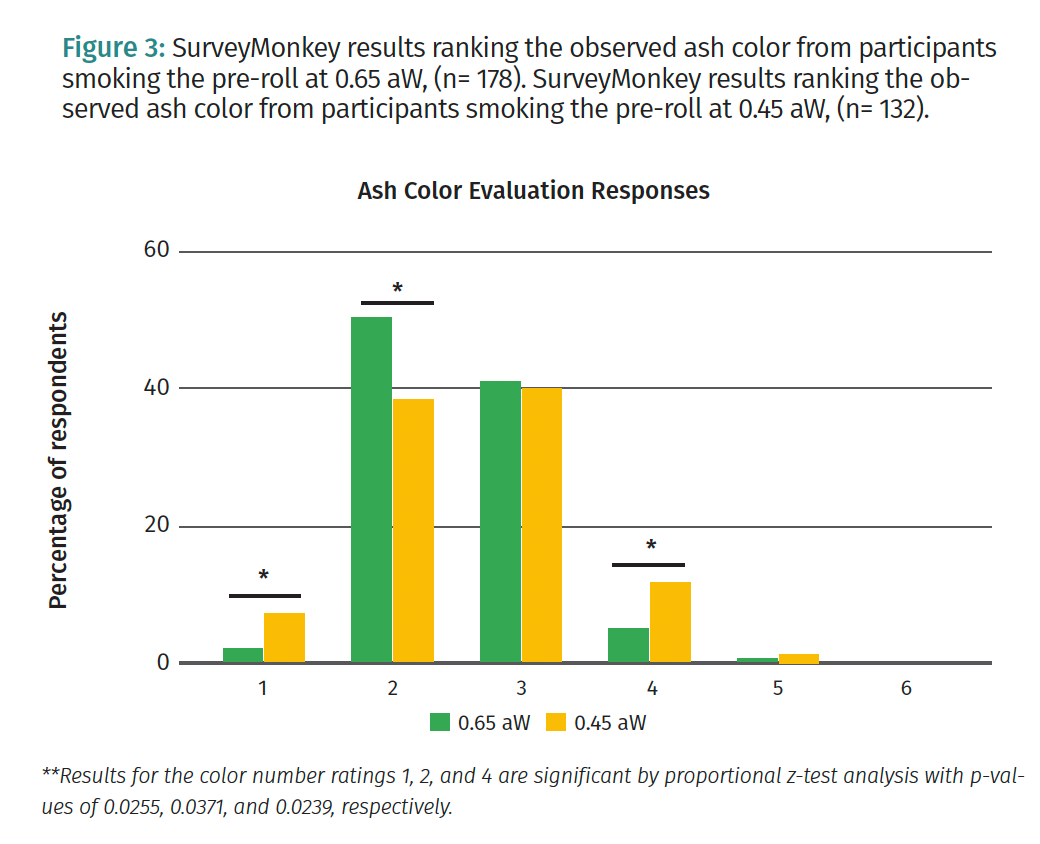
Similarly, ash color was evaluated by comparing ash color to a provided ‘ash color guide ranging from 1-6’ with 1 being the lightest and 6 being the darkest color (Figure S1). The results indicated that the ash color was consistently closer to white for both water activities. However, the color of the ash from the0.65 aW samples was lighter than that from the 0.45 aW samples (Figure 3), suggesting ash color may be affected by water activity.Comparison of the percentages of total responses of ash color by Z-test for the 0.45 and 0.65 aW groups found that the difference in response numbers 1, 2, and 4 were significantly different with p-values of 0.025, 0.037, and 0.024, respectively. The top response for 0.65 aW ash color #2, and for 0.45 aW ash color, #3 was the most frequent response. These findings suggest that sensory attributes were generally stable across the tested conditions, but that there was an observed variation between the 0.45 and 0.65 samples in ash color.
These results indicate that while some attributes of the sensory and consumer experience are not affected by water activity, others such as irritability and ash color may be affected.

. SurveyMonkey results ranking the observed ash color from participants smoking the pre-roll at 0.45 aW, (n= 132).")
Figure 3: SurveyMonkey results ranking the observed ash color from participants smoking the pre-roll at 0.65 aW, (n= 178). SurveyMonkey results ranking the observed ash color from participants smoking the pre-roll at 0.45 aW, (n= 132).
Discussion
While there may be additional variables and observable changes depending on the methodology of drying and curing to reach a desired water activity, this study provides novel insights into the chemical composition and user experiences associated with cannabis smoking, emphasizing the influence of water activity on cannabinoid and terpene delivery and user experiences.
Terpene analysis revealed that the 0.65 aW samples consistently delivered the highest concentrations of all terpenes analyzed, indicating that optimal water activity enhances the terpene yield during smoking. This finding is important, as terpenes contribute to the flavor and aroma of cannabis and may modulate its psychoactive effects.(36-40) Furthermore, the variability in delivered terpene profiles between the three test groups suggests that water activity not only influences overall yield but also relative volatilization of these compounds, with potential implications for differences in consumer experience.
Surprisingly, our findings indicate that aW had no effect on cannabinoid yield for consumer-relevant water activities. The highest cannabinoid concentration was measured in smoke from pre-rolls with a 0.65 aW but were not significantly different from the 0.45 aW samples. The 0.85 aW samples, which are not safe to consume for users due to potential microbial growth, showed substantially lower concentrations of both cannabinoids and terpenes. This is likely due, at least in part, to the increased pull resistance experienced at 0.85 aW. This suggests that moisture content affects cannabinoid yield during smoking, potentially due to improved combustion efficiency or aerosol formation. Notably, THC and CBG demonstrated higher yields compared to CBD and CBC for all measured water activities, though the underlying mechanisms remain unclear.
The complete decarboxylation of acidic cannabinoids, such as CBDA, during combustion is known from previous reports, confirming that heating during smoking decarboxylates acidic cannabinoids to their neutral forms. This decarboxylation of the acidic cannabinoids is crucial, because the pharmacological effects of cannabinoids differ between their acidic and neutral forms.(40,41)
Elemental analysis of the ash showed minimal variability between different aW samples, with most elements exhibiting approximately a seven-fold increase in concentration when the flower was combusted to produce ash. However, the high sulfur and phosphorus content in cannabis ash is atypical and not observed in tobacco ash. This could be explained by differences in cultivation and fertilization practices between crops. This warrants further investigation to validate the implications of elevated elemental concentrations for consumer health and product quality.
Ash color is anecdotally an important factor in determining quality cannabis from a community perspective with the common perspective being darker ash is correlated with a lower quality smoking experience.(42) Despite the small differences in chemical profiles in the smoke from pre-rolls with different water activities, the qualitative survey results indicate that consumers experience differences between them. This may affect the medicinal value of the products. Consumers who smoked the pre-rolls at 0.45 aW reported a more irritating experience than at 0.65 aW (Figure 2, Figure 3) as well as differences in ash color with 0.65 aW samples having lighter ash color compared to 0.45 aW samples. The increased irritation at lower water activity may have implications in user experience andinflammatory response which could affect the medicinal potential of the products. The overall experience users noted between the 0.45 samples and 0.65 samples was 45.2 vs 54.2, respectively; noting that 0.45 aW samples were reported more frequently as ‘moderately irritating’ while 0.65 aW samples leaned more toward ‘not irritating at all’. These results suggest that water activity affects some components of the smoking experience, although individual preferences and perceptions may vary.Figure 2, Figure 3) as well as differences in ash color with 0.65 aW samples having lighter ash color compared to 0.45 aW samples. The increased irritation at lower water activity may have implications in user experience andinflammatory response which could affect the medicinal potential of the products. The overall experience users noted between the 0.45 samples and 0.65 samples was 45.2 vs 54.2, respectively; noting that 0.45 aW samples were reported more frequently as ‘moderately irritating’ while 0.65 aW samples leaned more toward ‘not irritating at all’. These results suggest that water activity affects some components of the smoking experience, although individual preferences and perceptions may vary.
This study represents one of the first to investigate cannabis smoking by measuring both subjective measurements of quality as reported by consumers and objective measurements from chemical analysis. Our findings underscore the importance of water activity in influencing the chemical composition of cannabis smoke, with potential implications for both product quality and consumer health and experience. Future research should explore the mechanisms underlying the observed differences in cannabinoid and terpene yields from pre-rolls at different water activities, as well as the health implications of elevated elemental concentrations in cannabis ash. Additionally, studies incorporating larger sample sizes and diverse consumer demographics would provide a more comprehensive understanding of the factors influencing cannabis smoking experiences.
The smoke machine puff profile method used in this study was developed by Health Canada for the analysis of tobacco smoke. The smoking profiles of tobacco versus cannabis smokers are likely different in the time between puffs, the duration of the puff and the intensity of the puff. Future research by the authors will present a more accurate method for the Cambustion smoke machine that will use consumer data to implement a more accurate method of smoke analysis.
Financial Impact of Water Activity
Water activity and moisture content (MC) are closely related parameters but are not directly interchangeable. In this study, differences in weight and potential quality were evaluated between two water activity levels: 0.45 aW and 0.65 aW, which represent typical variations encountered in commercial cannabis processing. To quantify financial implications, it is essential to translate water activity values into corresponding moisture content levels; a water activity of 0.45 equates to approximately 5% MC, whereas 0.65 corresponds to roughly 9% MC. This conversion reveals an actual dry matter weight difference of 18.14 grams per pound of cannabis flower between the two moisture content levels. At an assumed market price of $1.50 per gram, this weight differential represents an estimated revenue loss of $27.20 per pound for material at the lower water activity level (0.45 aW, 5% MC).
These results emphasize the substantial economic impacts associated with precise water activity management during post-harvest cannabis processing. Future research should investigate the complex interplay between water-driven weight variations, quality parameters, and consumer preferences to deliver evidence-based guidance that enables cultivators to maximize both product quality and profitability.
Conclusion
In conclusion, our research highlights the critical role of water activity in modulating the chemical constituents of cannabis smoke. By optimizing water activity levels, it may be possible to enhance the delivery of desirable compounds, such as cannabinoids and terpenes, while minimizing the presence of potentially harmful elements. Additionally, consumers could not tell the difference between pre-rolls prepared at 0.45 aW and 0.65 aW suggesting lower water activity may be safer for shelf life and avoiding microbial growth. These findings contribute to the growing body of knowledge aimed at improving the safety and quality of cannabis products in an increasingly widespread context of use.
References
- Eyal, A. M.et al. Inconsistency in the Composition of the Smoke of a Cannabis Cigarette as Smoking Progresses: Results, Mechanism, and Implications. Cannabis and Cannabinoid Research, 2024, 9 (5), 1235–1249. DOI: 10.1089/can.2023.0123
- Maertens, R. M.; White, P. A.; Williams, A.; et al. A Global Toxicogenomic Analysis Investigating the Mechanistic Differences between Tobacco and Marijuana Smoke Condensates In Vitro. Toxicol. Sci., 2013, 131 (2), 529–542. DOI: 10.1093/toxsci/kfs285
- Sheehan, T.; Hamnett, H.; Beasley. R., et. al. Chemical and physical variations of cannabis smoke from a variety of cannabis samples in New Zealand. Forensic Sci Res.2018, 4(2):168-178. DOI: 10.1080/20961790.2018.1445937
- Mausner, M.; Gordon, L.; White, R. The Genotoxicity of Mainstream and Sidestream Marijuana and Tobacco Smoke Condensates. Mutat. Res.2009, 678 (1–2), 35–44. DOI: 10.1016/j.mrgentox.2009.06.005
- AppliedPharmacognosy. What Does a Stoner Look Like? (NECANN Boston Community Data). https://www.appliedpharmacognosy.org/blog/what-does-a-stoner-look-like-necann-boston-community-data (accessed 2025-01-10).
- AppliedPharmacognosy. An Early Analysis of the Most Comprehensive Longitudinal Dataset of the Cannabis Community. https://www.appliedpharmacognosy.org/blog/early-analysis-of-the-most-comprehensive-longitudinal-dataset-of-the-cannabis-community (accessed 2025-01-10).
- Wylie, P. L.; Turner, S. E.; Riedl, K. M.; et al. Vapor Pressure, Vaping, and Corrections to Misconceptions Related to Medical Cannabis’ Active Pharmaceutical Ingredients’ Physical Properties and Compositions. Cannabis Cannabinoid Res.2022, 7 (3), 201–215. DOI: 10.1089/can.2021.0173
- Carter, B. P.; Group, N. The Role of Water Activity in Cannabis Quality and Safety. J. Cannabis Res.2023, 5 (1), 12. DOI: 10.1186/s42238-023-00056-7
- Das, P. C.; Vista, A. R.; Tabil, L. G.; et. al. Postharvest Operations of Cannabis and Their Effect on Cannabinoid Content: A Review. Bioengineering, 2022, 9 (8), 364. DOI: 10.3390/bioengineering9080364
- AL Ubeed, H. M. S.; Wills, R. B. H.; Chandrapala, J. Post-Harvest Operations to Generate High-Quality Medicinal Cannabis Products: A Systemic Review. Molecules, 2022, 27 (5), 1719. DOI: 10.3390/molecules27051719
- Chasiotis, V.; Tsakirakis, A.; Termentzi, A.; et. al.; Filios, A. Drying and Quality Characteristics of Cannabis Sativa L. Inflorescences under Constant and Time-Varying Convective Drying Temperature Schemes. Therm. Sci. Eng. Prog.2022, 28, 101076. DOI: 10.1016/j.tsep.2021.101076
- Challa, S. K. R.; Misra, N. N.; Martynenko, A. Drying of Cannabis—State of the Practicesand Future Needs. Drying Technol.2021, 39 (14), 2055–2064. DOI: 10.1080/07373937.2020.1752230
- Punja ZK, Ni L, Lung S, Buirs L. Total yeast and mold levels in high THC-containing cannabis (Cannabis sativa L.) inflorescences are influenced by genotype, environment, and pre-and post-harvest handling practices. Front Microbiol.2023 Jun 13;14:1192035. doi: 10.3389/fmicb.2023.1192035. PMID: 37383630; PMCID: PMC10294073.
- Zhang, Q.; Geng, Z.; Li, D.; et. al. Characterization and Discrimination of Microbial Community and Co-Occurrence Patterns in Fresh and Strong Flavor Style Flue-Cured Tobacco Leaves. MicrobiologyOpen, 2020, 9 (2), e965. DOI: 10.1002/mbo3.965
- Ishizaki, H.; Akiya, T. Effects of Chlorine on Growth and Quality of Tobacco. Plant Soil, 1978, 50 (1–2), 217–224. DOI: 10.1007/BF02107102
- Zhang, J.; Li, Y.; Wang, Y. Application of Starch Degrading Bacteria from Tobacco Leaves in Improving the Flavor of Flue-Cured Tobacco. Front. Microbiol.2023, 14, 1211936. DOI: 10.3389/fmicb.2023.1211936
- Liu, Y.; Zhang, X.; Li, Y.; et al. Effects of Bacillus altitudinis Inoculants on Cigar Tobacco Leaf Fermentation. Front. Bioeng. Biotechnol.2024, 12, 1417601. DOI: 10.3389/fbioe.2024.1417601
- Wang, J.; Li, Y.; Zhang, X.; et al. Application of Pectin Hydrolyzing Bacteria in Tobacco to Improve Flue-Cured Tobacco Quality. Front. Bioeng. Biotechnol.2024, 12, 1340160. DOI: 10.3389/f
- Zhang, L.; Li, Y.; Wang, Y.; et al. Carbohydrates—Key Players in Tobacco Aroma Formation and Quality Determination. Molecules, 2020, 25 (7), 1734. DOI: 10.3390/molecules25071734
- Mendell, S.; Bourlas, E. C.; DeBardeleben, M. Z. Factors Influencing Tobacco Leaf Quality: An Investigation of the Literature. Contrib. Tob. Res.1984, 12 (3), 123–130. DOI: 10.2478/cttr-2013-0537
- Li, Y.; Zhang, X.; Wang, Y.; et al. Analysis of the Relationship between Color and Natural Pigments of Tobacco Leaves during Curing. Sci. Rep.2023, 13, 50801. DOI: 10.1038/s41598-023-50801-1
- Ng, L.-K.; Hupé, M. Effects of Moisture Content in Cigar Tobacco on Nicotine Extraction: Similarity between Soxhlet and Focused Open-Vessel Microwave-Assisted Techniques. J. Chromatogr. A, 2003, 1011 (1), 213–219. DOI: 10.1016/S0021-9673(03)01178-6
- Djordjevic, M. V.; Doran, K. A. Nicotine Content and Delivery Across Tobacco Products. Nicotine Psychopharmacology; Henningfield, J. E., London, E. D., Pogun, S., Eds.; Springer: Berlin, Heidelberg, 2009; pp 61–82. DOI; 10.1007/978-3-540-69248-5_3
- Chen, J.; Li, Y.; He, X.; et. al. Influences of Different Curing Methods on Chemical Compositions in Different Types of Tobaccos. Ind. Crops Prod.2021, 167. DOI: 10.1016/j.indcrop.2021.113534
- Dumas, A. W. Tobacco Ash. J. Natl. Med. Assoc.1937, 29 (3), 103–104.
- Chen, J.; Li, Y.; He, X.; et. al. Influences of Different Curing Methods on Chemical Compositions in Different Types of Tobaccos. Ind. Crops Prod.2021, 167, 113534. DOI: 10.1016/j.indcrop.2021.113534
- Mendell, S.; Bourlas, E. C.; DeBardeleben, M. Z. Effects of Curing and Fertilization on Nitrosamine Formation in Bright and Burley Tobacco. Contrib. Tob. Res.1984, 12 (3), 123–130. DOI: 10.2478/cttr-2013-0625
- ISO 3308:2012. Routine Analytical Cigarette-Smoking Machine—Definitions and Standard Conditions; International Organization for Standardization: Geneva, Switzerland, 2012.
- Van Rossum, G. Python tutorial. Technical Report CS-R9526, Centrum voor Wiskunde en Informatica (CWI), Amsterdam, May 1995.
- Seabold, S., and Perktold, J. Statsmodels: Econometric and statistical modeling with python. Proceedings of the 9th Python in Science Conference.2010.
- Oswald, I. W. H, et al. Minor, Nonterpenoid Volatile Compounds Drive the Aroma Differences of Exotic Cannabis. ACS Omega, 2023, 8 (42), 39203–39216. DOI: 10.1021/acsomega.3c04496
- Paryani, T. R., et al. Nonterpenoid Chemical Diversity of Cannabis Phenotypes Predicts Differentiated Aroma Characteristics. ACS Omega, 2024, 9 (26), 28806–28815. DOI: 10.1021/acsomega.4c03225
- Oswald, I. W. H. et al. Identification of a New Family of Prenylated Volatile Sulfur Compounds in Cannabis Revealed by Comprehensive Two-Dimensional Gas sChromatography. ACS Omega, 2021, 6 (47), 31667–31676. DOI: 10.1021/acsomega.1c04196
- Cockson, P.; Schroeder-Moreno, M.; Veazie, P.; Barajas, G.; Logan, D.; Davis, M.; Whipker, B.E. Impact of Phosphorus on Cannabis sativa Reproduction, Cannabinoids, and Terpenes. Appl. Sci.2020, 10, 7875. DOI: 10.3390/app10217875
- Westmoreland, F. M.; Erlandson, S.; Bugbee, B. Sustainable Cannabis Nutrition: Elevated Root-Zone Phosphorus Reduces Phosphorus Use Efficiency without Improving Yield or Quality. Front. Plant Sci.2022, 13, 9724152. DOI: 10.3389/fpls.2022.9724152
- Raz N, Eyal AM, Zeitouni DB, Hen-Shoval D, Davidson EM, Danieli A, Tauber M, Ben-Chaim Y. Selected cannabis terpenes synergize with THC to produce increased CB1 receptor activation. Biochem Pharmacol.2023 Jun; 212:115548. doi: 10.1016/j.bcp.2023.115548. Epub 2023 Apr 19. PMID: 37084981.
- Roell MS. Terpenes in Cannabis: Solving the Puzzle of How to Predict Taste and Smell. Plant Physiol.2020 Sep; 184 (1):8-9. doi: 10.1104/pp.20.00919. PMID: 32900972; PMCID: PMC7479895.
- de la Fuente A, Zamberlan F, Sánchez Ferrán A, Carrillo F, Tagliazucchi E, Pallavicini C. Relationship among subjective responses, flavor, and chemical composition across more than 800 commercial cannabis varieties. J Cannabis Res. 2020 Jul, 17; 2(1):21. doi: 10.1186/s42238-020-00028-y. PMID: 33526118; PMCID: PMC7819481.
- LaVigne JE, Hecksel R, Keresztes A, Streicher JM. Cannabis sativa terpenes are cannabimimetic and selectively enhance cannabinoid activity. Sci Rep.2021 Apr 15; 11(1):8232. doi: 10.1038/s41598-021-87740-8. PMID: 33859287; PMCID: PMC8050080.
- Shields, M. and Kirk, R. Pharmaceutical Applications of Hemp. Revolutionizing the Potential of Hemp and Its Products in Changing the Global Economy, Springer, 2022.
- Kim, ES., Park, SH., Kinney, C.A. et al. Comparison of decarboxylation rates of acidic cannabinoids between secretory cavity contents and air-dried inflorescence extracts in Cannabis sativa cv. ‘Cherry Wine’. Sci Rep., 2024 14, 16411. https://doi.org/10.1038/s41598-024-66420-3
- White Ash vs. Black Ash. Cannabis Business Times. 2023. https://www.cannabisbusinesstimes.com/columns/guest-column/article/15699165/white-ash-vs-black-ash
Acknowledgment
The Science of Smokability study would not have been possible without the generous support and collaboration of our sponsors and contributors. This two-plus-year research endeavor represents a significant step forward in understanding the relationship between cannabis drying techniques and consumer preferences, and it would not have been achievable without their invaluable contributions. We extend our deepest gratitude to DaySavers, Cannatrol, Custom Cones USA, Plant Life Co, Boveda, Abstrax Tech, Ganjier, Lone Pine Farm & Studio, Curaleaf, The Hemp Mine, MCR labs. Your commitment to advancing cannabis research and innovation has been instrumental in making this project a reality.
To our sponsors and collaborators:
Thank you for your unwavering support, dedication, and shared vision for a more sustainable, informed, and consumer-focused cannabis industry. This research is a testament to the power of partnership in driving meaningful progress.
Special thanks to Scott Churchill, Giancarlo Fuela, Dr. Iain Oswald, PhD, and Twinkle Paryani for directly contributing to the research.


Best of the Week: May 9 – May 15, 2025
May 16th 2025Here, we bring you our top five recent articles covering cannabis legalization bills in Pennsylvania and Virginia, hemp regulation compliance in California, the first map of tribal cannabis and hemp programs, and a study on cannabis consumption and a sedentary lifestyle.


